COVID-19 is Not Just Like the Annual Flu
Not your mother’s pandemic!
 featured-flu
Table of Contents
Over the six months of the coronavirus pandemic in the US, I have had many casual conversations with strangers or family in which the individual suggests that “COVID-19 is just like an annual flu.” This notion is far from the truth even in the face of a general similarity that they are both respiratory infections. In this post I compare quantitative features of COVID-19 with H1N1 and other flu-like illnesses, Ebola virus disease (EVD), and SARS to show differences between COVID-19 and the flu. Of course, this is not the first time these comparisons have been made in public media; rather, this post is only my perspective on the issue.
There are several ways in which the ongoing COVID-19 pandemic and some recent other pandemics can be compared. Sometimes, the endpoints for comparing the pandemic are cherry-picked to support the individual’s or organization’s purpose. But generally speaking, quantitative comparisons of pandemics begin using fundamental measures, such as
- the number of cases,
- the number of deaths, and
- the population size.
Although these pandemic measures start with the seemingly simple process of counting cases and deaths, the luxury of that simplicity is seldom achievable. Each numerical comparison is nuanced and sometimes even specific to which outbreak of complex disease. The field of epidemiology–the study of diseases in populations–uses these fundamental measures to derive more specific measures of incidence, prevalence, and risk (Below). Trained infectious disease scientists and clinicians seldom made casual comparisons using only the above terms, but instead, carefully state the assumptions and possibly caveats necessary to make scientifically valid comparisons using an array of terms. For this post, we’ll assume that such simplifying assumptions and caveats could be easily resolved.
Comparing the number of cases
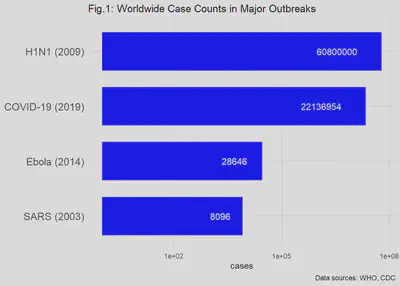
The number of cases (“case counts”) is a basic measure used to routinely monitor diseases in addition to detecting an emerging epidemic disease.^[Both chronic and infectious diseases are counted on a regular basis as part of public health risk management. The CDC website has a good explanation of surveillance: CDC Surveillance] The following figure (Fig.1) shows the worldwide case counts for the past SARS, EVD and H1N1 (Swine Flu) outbreaks and the ongoing COVID-19 pandemic. Note that the horizontal axis is a logarithmic scale, e.g., moving in powers of 10 (10, 100, 1000, 10000, …). If not shown that way, the tens of millions of cases in COVID-19 and H1N1 would visually swamp the thousands-fold fewer cases of Ebola and SARS. (You would need a very wide monitor to display the graph!)

Death Counts Tell a Different Story
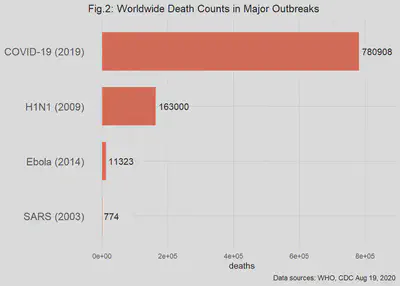
The total deaths due to the outbreaks are shown in Fig. 2. Here I dropped the log scale to show the dramatic differences among the past and ongoing outbreaks. For example, the SARS outbreak from a coronavirus, disappears as a significant cause of worldwide mortality.

The data reported during and after an outbreak is likely to include the proportion of cases or deaths in the population. Sometimes these proportions are called the “normalized cases (or deaths).” At the simplest level, these proportions are simply the number of cases/deaths divided by the size of the population of concern. Because populations of interest in epidemiology are often large, the ratio is adjusted to the “number of cases/deaths per 100,000 in the population.” For example, if we found 200 cases in a population of 250,000 people, the normalized cases are:
This mathematical result, while certainly correct, leaves us with trying to imagine a 0.0008 illness. Thus, we can bring the proportion back to the realm of whole people by multiplying the proportion by 100,000:
“Normalizing” the case/death counts by population size makes sense for the comparison of the intensity of an outbreak from one administrative boundary to the next. For example, if the administrative boundary is " county" and the example is compared with a second county also having 200 cases of disease but a population size of 1M, then the normalized comparison is 80 versus 20 cases per 100,000. Clearly, the counties that were apparently equal in case counts now are 4-fold different in the normalized case counts.
Higher Order Measures in Outbreaks
The base counts are seldom sufficient for making comparisons among outbreaks and pandemics. For example, if we look at only total case counts, then we have only a cumulative counting measure that begins at the index (first) case and ends some period of time later when no new cases are observed. But the rate of accumulation of new cases might be more relevant to public health planning because it informs the rate at which health services will be needed for case management. There are several higher order or derived measures of an outbreak that are more useful for understanding not only the population disease process itself, but also the possible demand on health care resources. Such derived measures include, among others:
- incidence (incidence rate; incidence proportion)
- prevalence
- person-years at risk
- case fatality ratio
- infectivity
- virulence
- modes of transmission
A short blog is not suited for carefully defining all of these terms and then using them to compare outbreaks. I recommend online sources including basic epidemiology text published by CDC.^[Principles of Epidemiology in Public Health Practice, Third edition] We will continue our simplified comparison of outbreaks with only a few key measures.
Comparing the case fatality ratios
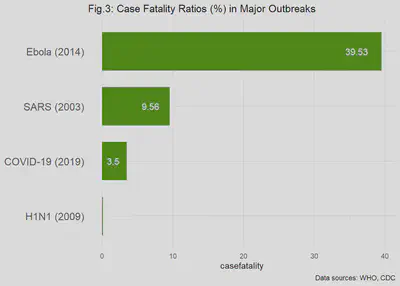
The case fatality proportion (also called the case fatality ratio or rate) is a basic measure of great importance in infectious disease epidemiology. The measure gets right to the point of, “how lethal is this disease?” It is typically defined as the number of cases of a disease that end in death from a specific cause divided by the total number of cases of that disease in a defined population. This endpoint is used colloquially to express the risk of death, given that the individual has the disease. In other words, what percentage of true cases are expected to die? Using the case fatality ratio (CFR) is where the comparisons of the major outbreaks is turned on its head: now, the relatively low risk of having Ebola virus disease (EVD) looks much worse because, given the patient has EVD, the likelihood of death is about 40%! By comparison, the relative chance of death, given an H1N1 infection is 400 times less than the risk of death from EVD. We will visit more characteristic of case fatality ratios in a later post; but for now, look at Fig. 3 for the remarkable differences among the CFRs the pandemics in question.

Other Comparisons
Infectivity and Modes of Transmission
Viral infectivity is the ability of a pathogen to establish infection. Virulence is a measure that is really at the interface between the environment–air, water, other fluids and solid surfaces–and the host. In other words, if the viral particles are in the air that the host breathes, what is the likelihood that the host will be infected? Viral infectivity is correlated (positive) with the virulence of the virus. Although we might attempt to compare the infectivity of the three outbreaks in the abstract, in fact, the modes of transmission are different, complicating a simple comparison. The coronavirus causing SARS and COVID-19 are clearly transmitted primarily by inhalation of contaminated air, whereas the infection by Ebola virus is through contact with bodily fluids, tissues and contaminated surfaces from an EVD patient.
Derived measures
Prevalence and incidence are two classical epidemiology measurements that are derived from the number of cases or deaths. The first of these–prevalence– is the proportion of cases in a defined population at a fixed time point. The “defined population” is central to both the epidemiology of a single outbreak and the comparison of different outbreaks and from possibly different viruses. Defined population can be based on administrative boundaries, e.g., the population within a county, state, country or continent; or, the definition might be a specific age group with other characteristics. The wide range of possible definition makes prevalence-based a potential minefield of errors.
The incidence or incidence rate of disease is also difficult to use in comparisons across types of outbreaks. Incidence refers to the number of new cases in a defined population of susceptible hosts over a set period of time (e.g., “per year”). Incidence rates suffer from the same challenges of the related prevalence of disease.
Outbreak measures can and do change
While it might appear that the fundamental measurements in epidemiology, cases and deaths, can be easily tallied, in fact the true number of cases/deaths in an outbreak can be difficult to obtain and might not even be known for several years after the outbreak!^[For example, the total cases in the H1N1 influenza (2009) cases are still uncertain a decade after the outbreak.] This happens because the signs and symptoms for many infectious diseases are overlapping, and might even overlap with those of the infected person’s pre-existing conditions. If there is no way to clearly identify the infectious agent, then the clinician diagnoses the disease by comparing with a current knowledge base of signs and symptoms. With a novel disease like COVID-19, the scientific and regulatory communities will debate the exact definition of a COVID-19 case in the midst of the pandemic because the “recognized” signs and symptoms are likely to change with more experience.
In conclusion, I have shown that just a few simplistic comparisons using basic epidemiologic measures can easily dispel the notion that the ongoing COVID-19 pandemic is “just like the annual flu.” A deeper dive into the specifics of infectivity, virulence, age-dependency and co-morbidities would take volumes to discuss in even moderate depth. More importantly, the knowledge base on COVID-19 is rapidly evolving due to the efforts of scientists and public health officials to gather and share data. As Dr. Anthony Fauci remarked recently, understanding the long-term effects of COVID-19 is a “work in progress."^[CNN].